Effective April 1, 2024 the UMass Amherst Libraries will be pausing submissions to ScholarWorks as we transition to a new software platform. If you'd like to submit an item during this pause, please use this submission form to OneDrive.
ScholarWorks offers long-term storage and public access to the data and datasets produced by labs and researchers at UMass Amherst. You can submit your own data to ScholarWorks, or email the Data Working Group to schedule an appointment, ask questions, or learn more about how to deposit your data with us!
-

Designing Sustainable Landscapes: Substrate mobility settings variable
Kevin McGarigal, Brad Compton, Ethan B. Plunkett, Bill DeLuca, and Joanna Grand
Substrate mobility is one of several ecological settings variables that collectively characterize the biophysical setting of each 30 m cell at a given point in time (McGarigal et al 2017). Substrate mobility measures the realized mobility of the physical substrate, due to both substrate composition (e.g., sand) and exposure to forces (wind and water) that transport material. This is an important attribute of certain dynamic systems (e.g., coastal dune systems); given as a simple index of mobility (1 = stable, 10 = highly mobile). Substrate mobility is assigned by landcover class, derived from expert opinion. This settings variable is dynamic, changing with urban growth.
-

Designing Sustainable Landscapes: Stream temperature settings variable
Kevin McGarigal, Brad Compton, Ethan Plunkett, Bill DeLuca, and Joanna Grand
Stream temperature is one of several ecological settings variables that collectively characterize the biophysical setting of each 30 m cell at a given point in time (McGarigal et al 2017). Several fish species (e.g., brook trout) can only survive in coldwater streams, which have higher levels of dissolved O2, while other fish species are adapted to warmer streams. At the same time, ectotherms such as aquatic insects and fish can develop more quickly in warmer streams. Stream temperature is a coarse classification of streams by mean annual temperature.
-

Designing Sustainable Landscapes: Soil available water supply, Soil depth to restrictive layer, and Soil pH settings variables
Kevin McGarigal, Brad Compton, Ethan Plunkett, Bill DeLuca, and Joanna Grand
These three soils variables are among several ecological settings variables that collectively characterize the biophysical setting of each 30 m cell at a given point in time (McGarigal et al 2017). Soils are important drivers of natural communities. We picked three soil attributes that represent the most important factors: depth, chemistry, and water-holding capacity. Depth to resistant layer measures the depth of soils to a restrictive layer (e.g., bedrock) that limits root depth. Areas with shallow soils (usually on steep slopes or ridgetops) can’t support deep-rooted plants. Soil pH strongly affects nutrient uptake by plants. In the east, soils with higher pH (e.g., in areas with limestone bedrock) tend to support a greater diversity of plants, including a number of species that typically grow only in sweet soils. Conversely, some groups of plants (such as members of Ericaceae) are specialized to acidic soils, where generalist species grow poorly at best. Available water supply (AWS) measures the water-holding capacity of soils. It is measured as the total volume of water that available to plants when the soil, inclusive of rock fragments, is at field capacity. Soils with a high AWS are more drought-resistant, supporting plant growth through periods without rain—for instance, good agricultural soils have a high AWS. AWS is calculated as the available water capacity times the thickness of each soil horizon to a specified depth (25 cm in this case). Note that AWS is distinct from our topographic wetness settings variable, which estimates the amount of water delivered to the soil at each point.
-

Designing Sustainable Landscapes: Slope settings variable
Kevin McGarigal, Brad Compton, Ethan Plunkett, Bill DeLuca, and Joanna Grand
Slope is one of several ecological settings variables that collectively characterize the biophysical setting of each 30 m cell at a given point in time (McGarigal et al 2017). Slope gives the percent slope at each cell. High slopes indicate a propensity for gravityinduced physical disturbance (e.g., talus slopes), which can limit plant development. Slope ranges from 0% for flat areas to theoretically infinity for absolutely vertical cliffs, though the actual maximum occurring in our landscape is 440%.
-

Designing Sustainable Landscapes: Potential dominant life form settings variable
Kevin McGarigal, Brad Compton, Ethan Plunkett, Bill DeLuca, and Joanna Grand
Potential dominant life form is one of several ecological settings variables that collectively characterize the biophysical setting of each 30 m cell at a given point in time (McGarigal et al 2017). Potential dominant life form (unvegetated, herbaceous, shrubland, woodland, forest) represents the structure of vegetative community at a site and is used, for example, to distinguish early successional forest from permanent grassland or shrubland. Potential dominant life form is assigned by landcover class, derived from expert opinion. This settings variable is dynamic, changing with urban growth.
-

Designing Sustainable Landscapes: Imperviousness settings variable
Kevin McGarigal, Brad Compton, Ethan Plunkett, Bill DeLuca, and Joanna Grand
Imperviousness is one of several ecological settings variables that collectively characterize the biophysical setting of each 30 m cell at a given point in time (McGarigal et al 2017). Imperviousness measures the percentage of the ground surface area that is impervious to water infiltration, which is an indicator of intensive development and thus an important determinant of ecological communities. This is a dynamic settings variable, increasing with future urban growth.
-

Designing Sustainable Landscapes: Incident solar radiation settings variable
Kevin McGarigal, Brad Compton, Ethan Plunkett, Bill DeLuca, and Joanna Grand
Incident solar radiation is one of several ecological settings variables that collectively characterize the biophysical setting of each 30 m cell at a given point in time (McGarigal et al 2017). The amount of sun affects temperature, moisture, and plant growth, affecting the communities found in each place.
-

Designing Sustainable Landscapes: Mean annual temperature, Growing season degree days, Heat index, Minimum winter temperature, and Maximum summer temperature settings variables
Kevin McGarigal, Brad Compton, Ethan Plunkett, Bill DeLuca, and Joanna Grand
These five temperture variables are among several ecological settings variables that collectively characterize the biophysical setting of each 30 m cell at a given point in time (McGarigal et al 2017). The temperature regime strongly affects species composition, as well as rates of ecological processes such as nutrient cycling. We’ve chosen five variables to represent different aspects of temperature. All five variables have future versions that incorporate climate change via General Circulation Models (GCMs) (as described in the technical document on climate, McGarigal et al 2017).
-

Designing Sustainable Landscapes: Traffic settings variable
Kevin McGarigal, Brad Compton, Ethan Plunkett, Bill DeLuca, and Joanna Grand
Traffic is one of several ecological settings variables that collectively characterize the biophysical setting of each 30 m cell at a given point in time (McGarigal et al 2017). Traffic measures the estimated probability of an animal crossing the road being hit by a vehicle given the mean traffic rate, an important determinant of landscape connectivity for mobile terrestrial organisms. It is based on an empirical model of mean vehicles per day, using point counts of traffic, and a transformation to estimate the mortality rate for road crossings. Traffic is a dynamic settings variable, increasing in future timesteps with urban growth.
-

Designing Sustainable Landscapes: Stream gradient settings variable
Kevin McGarigal, Brad Compton, Ethan Plunkett, Bill DeLuca, and Joanna Grand
Stream gradient is one of several ecological settings variables that collectively characterize the biophysical setting of each 30 m cell at a given point in time (McGarigal et al 2017). Stream gradient is a measure of the percent slope of a stream, which is a primary determinate of water velocity and thus sediment and nutrient transport, and habitat for aquatic plants, invertebrate, fish, and other organisms. Stream gradient is often approximated by categories such as pool, riffle, run, and cascade. Stream gradient is 0% for lentic waterbodies, palustrine, and uplands. It ranges from 0% to infinity (theoretically) for streams.
-

Designing Sustainable Landscapes: All Ecological Settings
Kevin McGarigal, Brad Compton, Ethan Plunkett, Bill DeLuca, and Joanna Grand
The ecological settings products include a broad suite of static as well as dynamic abiotic and biotic variables representing the natural and anthropogenic environment at each location (cell). Static variables are those that do not change over time (e.g., elevation, incident solar radiation). Dynamic settings are available for 2010 and 2080; static settings are available for 2010. Dynamic variables are those that change over time in response to succession and the drivers (e.g., growing season degree days, traffic rate). Most of the settings variables are continuous and thus represent landscape heterogeneity as continuous (e.g., slope, biomass), although some are categorical and thus represent heterogeneity as discrete (e.g., developed, hard development). Importantly, the settings variables include a broad but parsimonious suite of attributes that can be used to define the ecological system at any point in time; they are considered primary determinants of ecosystem composition, structure and function, and determine the ecological similarity between any two locations. As such, they play a key role in the ecological integrity assessment, they are used in species' habitat models to represent important habitat components, as appropriate, and are sometimes used in other model components. The settings provide a rich, multivariate representation of important landscape attributes.
-

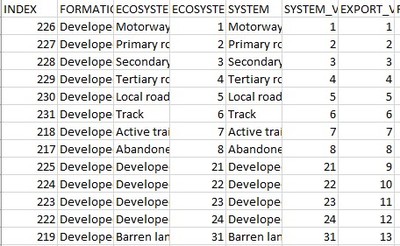
Designing Sustainable Landscapes: Development settings variable, Hard development settings variable
Kevin McGarigal, Brad Compton, Ethan Plunkett, Bill DeLuca, and Joanna Grand
Development and hard development are two of several ecological settings variables that collectively characterize the biophysical setting of each 30 m cell at a given point in time (McGarigal et al 2017). Development represents all development, scaled from 0 to 10 by development intensity. Hard development is a subset of development, with a value of 1 for very high intensity development only. Both layers come from DSLland, the primary landcover map. These are dynamic settings variables, increasing with future urban growth.
-

Designing Sustainable Landscapes: Biomass settings variable
Kevin McGarigal, Brad Compton, Ethan Plunkett, Bill DeLuca, and Joanna Grand
Vegetation biomass is an effective descriptor of the net primary productivity of an ecosystem. As such, it is a fundamental component of the ecosystem's trophic dynamics. In addition, vegetation biomass is an effective proxy for the successional development (or seral stage) of vegetation following a disturbance. Biomass is one of several ecological settings variables that collectively characterize the biophysical setting of each 30 m cell at a given point in time (McGarigal et al 2017). Specifically, biomass measures the estimated above-ground live biomass (Mg/ha) of undeveloped forested (including forested wetlands) cells in 2010 based primarily on a spectral analysis of Landsat imagery by USGS Woods Hole. Note that for forested ecosystems, we also model the predicted change in biomass between 2010-2080 using on a custom succession model trained using Forest Inventory and Analysis (FIA) plot data (see technical document on disturbance and succession, McGarigal et al 2017).
-

Designing Sustainable Landscapes: CaCO3 content settings variable
Kevin McGarigal, Brad Compton, Ethan Plunkett, Bill DeLuca, and Joanna Grand
Calcium carbonate (CaCO3) content is one of several ecological settings variables that collectively characterize the biophysical setting of each 30 m cell at a given point in time (McGarigal et al 2017). CaCO3 buffers acidity in soil and water, increasing nutrient uptake by plants, and providing a ready source of calcium for organisms such as aquatic insects. CaCO3 content (Fig. 1), affects the composition of natural communities both directly and indirectly, such that areas with high calcium have increased species richness and support a number of unique species.
-

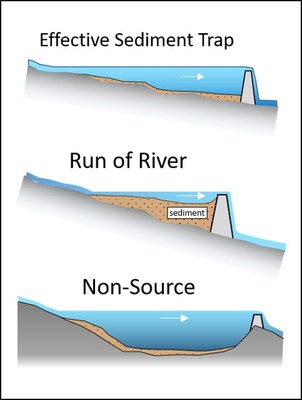
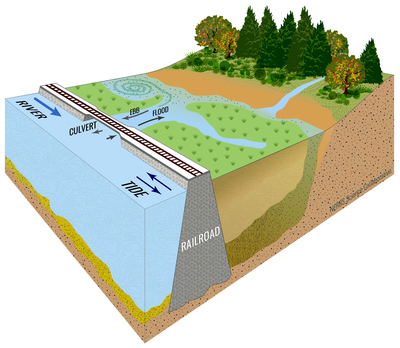
Designing Sustainable Landscapes: aquatic barriers settings variable
Kevin McGarigal, Brad Compton, Ethan Plunkett, Bill DeLuca, and Joanna Grand
Aquatic barriers is one of several ecological settings variables that collectively characterize the biophysical setting of each 30 m cell at a given point in time (McGarigal et al 2017). Aquatic barriers measures the relative degree to which road-stream crossings (i.e., bridges and culverts) and dams may physically impede upstream and downstream movement of aquatic organisms, particularly fish. It is derived from a custom algorithm (see below for details) applied to dams and derived road-stream crossings. Briefly, each dam has an aquatic barrier score based either on dam height or attributes indicating whether the dam has a partial/complete breach. Similarly, each road-stream crossing has an aquatic barrier score based either on an algorithm applied to field measurements of the crossing structure or predictions from a statistical model based on GIS data. Aquatic barriers is scaled 0-1, where dams and road-stream crossing are assigned values >0 (with 1=complete barrier) and all other cells (including terrestrial) are assigned 0.
-

Northeast Invasive Plants Data
Tyler Cross, John T. Finn, and Bethany Bradley
The data are distribution and ranked abundance data for thirteen invasive plants in the Northeast US compiled from various spatial repositories for invasive species. iMAP invasives data are not included in this dataset because they are not publicly available. iMAP data can be requested from individual states.
These data form the basis of analyses presented in Cross et al. 2017. "Frequency of invasive plant occurrence is not a suitable proxy for abundance in the Northeast US Ecosphere".
-
 by Bethany Bradley and Jenica Allen")
Distribution Locations of Invasive Species (Out of the Weeds? Reduced Plant Invasion Risk with Climate Change in the Continental United States)
Bethany Bradley and Jenica Allen
The comma-delimited data file includes the species code (see Supplemental Online Table S2 for full species names), latitude, and longitude in decimal degrees (WGS84) for the occurence points used in model fitting. Some data use agreements prohibit the publication of coordinate data and those points have been removed.
-

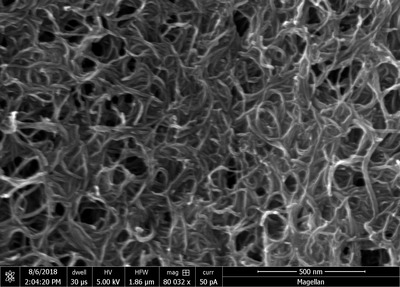
Data for "Interplay Between Ion Transport, Applied Bias and Degradation under Illumination in Hybrid Perovskite p-i-n Devices"
Emily C. Smith, Christie L.C. Ellis, Hamza Javaid, Lawrence A. Renna, Yao Liu, Thomas P. Russell, Monojit Bag, and Dhandapani Venkataraman
We studied ion transport in hybrid organic inorganic perovskite p-i-n devices as a function of applied bias under device operating conditions. Using electrochemical impedance spectroscopy (EIS) and equivalent circuit modeling, we elucidated various resistive and capacitive elements in the device. We show that ion migration is predictably influenced by a low applied forward bias, characterized by an increased capacitance at the hole transporting (HTM) and electron transporting material (ETM) interfaces, as well as through the bulk. However, unlike observations in n-i-p devices, we found that there is a capacitive discharge leading to ion redistribution in the bulk at high forward biases. Furthermore, we show that a chemical double layer capacitance buildup as a result of ion accumulation impacts the electronic properties of the device, likely by either inducing charge pinning or charge screening, depending on the direction of the ion induced field. Lastly, we extrapolate ion diffusion coefficients (~10-7 cm2 s-1) and ionic conductivities (~10-7 S cm-1) from the Warburg mass (ion) diffusion response, and show that, as the device degrades, there is an overall depletion of capacitive effects coupled with an increased ion mobility.
-

Ramsey-Musolf According data
Darrel Ramsey-Musolf
This CSV file contains the data pertaining to my research on housing plan quality and low-income housing production that was published in Urban Science.
-
 by Bethany Bradley and Jenica Allen")
Species Potential Range Predictions (Out of the Weeds? Reduced Plant Invasion Risk with Climate Change in the Continental United States)
Bethany Bradley and Jenica Allen
This PDF file contains the binary potential range prediction maps for each species in the dataset under current climate. The prediction map for each species lists the species code (see Supplemental Online Table S2 for full species names), areas predicted to be climatically suitable/unsuitable under current climate, and the occurrence points for the species. See the main publication for model fitting details.
-

Anthropogenic Ignitions
Emily J. Fusco, John T. Abatzoglou, Jennifer K. Balch, John T. Finn, and Bethany Bradley
This dataset contains ignition points derived from the MODIS Burned Area Product (MCD45) from 2000-2012), It also contains a random subset of unburned points. Both ignition and unburned points have associated anthropogenic feature data.
-
 by Eric E. Poehler")
The Evidence for Traffic (Data Tables)
Eric E. Poehler
The file, "Evidence_for_Traffic_at_Pompeii", is a spreadsheet containing the description of 1024 curbstones, guard stones, and stepping-stones, upon which the evidence for ancient traffic at Pompeii were inscribed. These data underlie and support the tables, figures, and arguments of Poehler, Eric. E. 2017 The Traffic System of Pompeii. (New York: Oxford University Press) and should be used in consultation with that work. Using tabs in the spreadsheet, these data are combined as a single table (Traffic_Evidence_All) and also divided into each object type. Field names are intended to be both human readable and in formats ready for use in other software environments. Copies of these data in more sustainable formats, such as .csv and .txt, are appended as additional files, but include only the combined data table.
-

Ignition Cause
Emily J. Fusco, John T. Abatzoglou, Jennifer K. Balch, John T. Finn, and Bethany Bradley
This dataset contains ignition points derived from the MODIS Burned Area Product (MCD45) from 2000-2012), It also contains the determined cause for each ignition.
-
 distribution across the Great Basin, USA by Bethany Bradley")
Model of cheatgrass (Bromus tectorum) distribution across the Great Basin, USA
Bethany Bradley
A description of the methods associated with this model can be found in:
Bradley, B.A., C.A. Curtis, E.J. Fusco, J.T. Abatzoglou, J.K. Balch, S. Dadashi, and M.N. Tuanmu. “Cheatgrass (Bromus tectorum) distribution in the intermountain western United States and its relationship to fire frequency, seasonality, and ignitions”, In Press, Biological Invasions
-
 percent cover data by Bethany Bradley")
Cheatgrass (Bromus tectorum) percent cover data
Bethany Bradley
A compilation of cheatgrass (Bromus tectorum) percent cover data across the western U.S. used to train a regional land cover map as well as assess relationships to fire.